Our cloud-based software service allows users to monitor power quality information in real-time. It allows users of our OHM hardware devices to view and analyze all power quality events. Finally, it allows users to share their power quality information as “open data”.
Overview of Software Design
OPQ-ao is designed using the Play Framework and deployed on CloudBees. A MySQL database is used for back end storage requirements. The front end user interface utilizes the Bootstrap UI framework. We also use the Leaflet map library along with Open Street Map data to provide real time visualizations of power quality alerts.
Our software allows users to add and manage OPQ hardware devices. We also offer alert management which allows user to define, filter, view, search, and analyze power quality alerts. Users are also given the ability to anonymously share their power quality information so that others can view and analyze events at a larger grid-level scale. This gives researchers the ability to see how power quality is effected by events within a defined geographical area.
We believe that access to power quality information should be open and unrestricted. The source code to our cloud service can be found on our github page at https://github.com/openpowerquality/opq-ao and we welcome all contributions and bug reports.
Creating a New Account
Users setup an account and register their OPQ devices through a wizard:
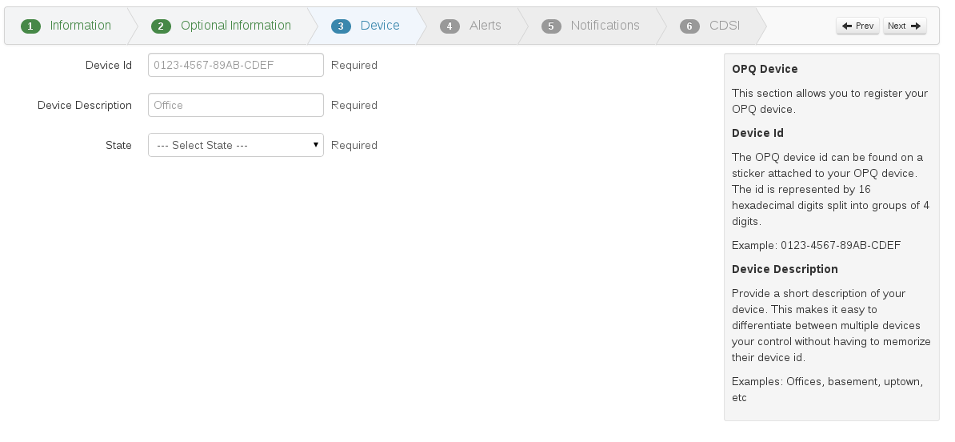
Wizard for new user setup.
Administration Panel
Once a user has setup their account, we provide management of user information, alert management, and device management.
Personal Power Quality Alerts
Users are able to view power quality alerts in real-time as they happen. This allows users to diagnose and understand what may be causing power quality alerts at the household level. Users can also annotate power quality alerts if they know or suspect the cause of the power alerts (i.e. refrigerator starting up or tropical storm Flossie). Users also have access to our search and filtering system so that they can find and analyze specific power quality events.
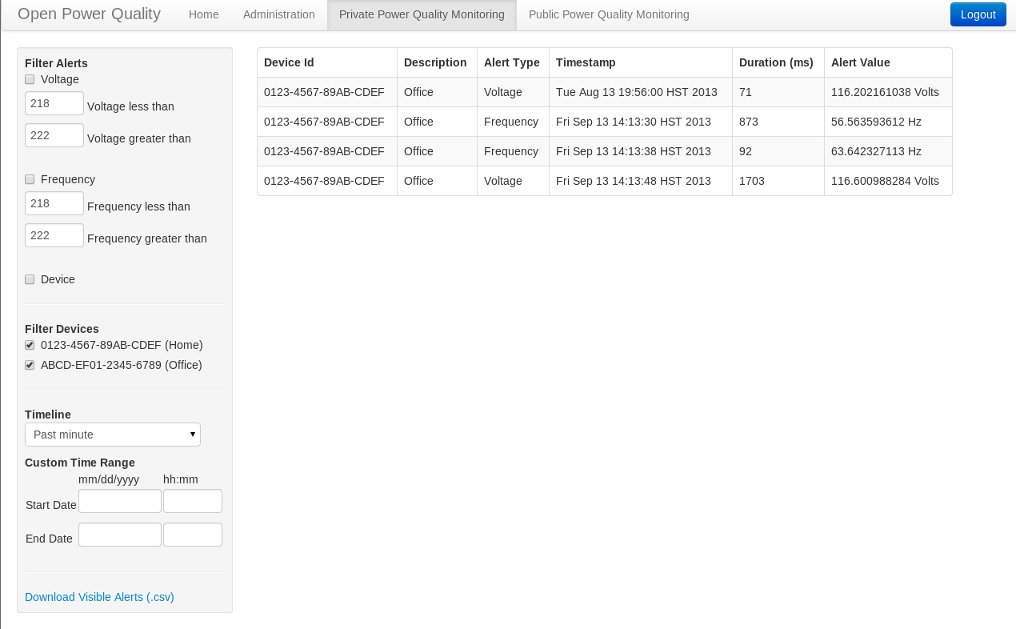
Private Alerts
Sharing Power Quality Information Anonymously
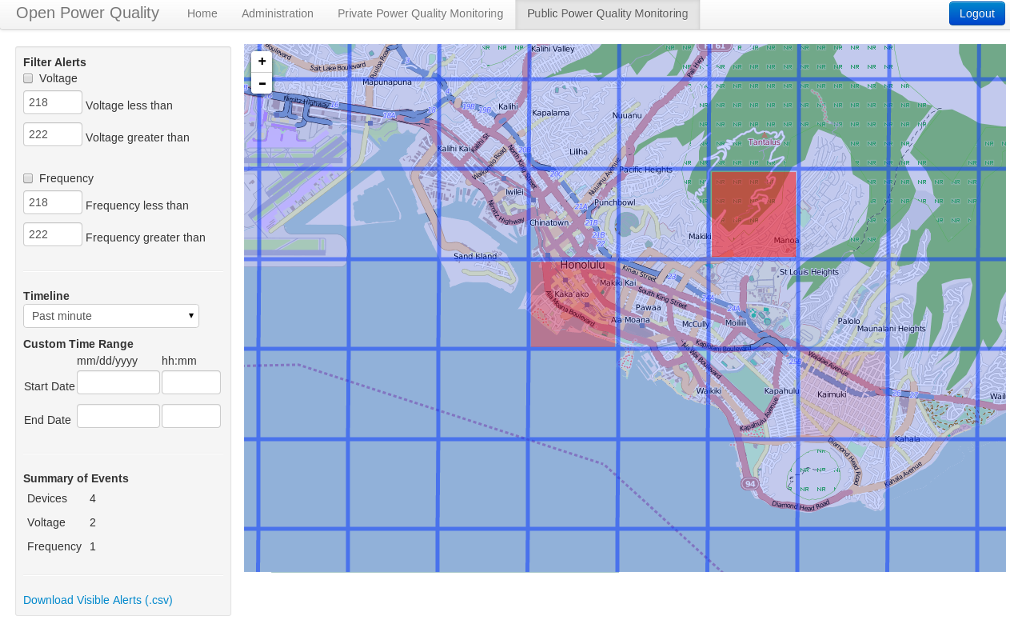
Users can share their power quality information by selecting from a map a grid cell which contains their device. Grid cells can be selected in size from 10,000 square meters down to 100 meters. This enables the user to provide as little or as much location data as they feel comfortable with.
Public Power Quality Information
We use the same map interface to share publicly available power quality information that is filterable and searchable. In the near future, we hope to include an animated map which will allow researches to view power quality events taking place through time at a set interval similarly to how animated radar maps function.
This interface gives researchers the ability to view power quality information at the grid level. It’s possible to track events as they propagate through a geographical area. This is useful for looking at the effects of storms, weather information and its effects on solar generation, and other events which may cause instability on the power grid.
Public Power Quality Alerts
Demo availability
We have a development prototype up and running and we’re continuing to improve and add features every week. Our live demo is deployed on CloudBees at http://opq-ao.pele.cloudbees.net/.
